
You’re offline. This is a read only version of the page.

Visit our Marketing Theories Page to see more of our marketing buzzword busting blogs.
If you are working with a product portfolio you have a range of tools at your disposal to determine how each one or a group of the products are doing. You could consider using the Product Life Cycle but if you need a current “snap shot” of how the products are doing you would benefit more from using the Boston Consulting Group Matrix.
Back in 1968 a clever chap from Boston Consulting Group, Bruce Henderson, created this chart to help organisations with the task of analysing their product line or portfolio.
The matrix assess products on two dimensions. The first dimension looks at the products general level of growth within its market. The second dimension then measures the product’s market share relative to the largest competitor in the industry. Analysing products in this way provides a useful insight into the likely opportunities and problems with a particular product.
Products are classified into four distinct groups, Stars, Cash Cows, Problem Child and Dog. Let's have a look at what each one means for the product and the decision making process.
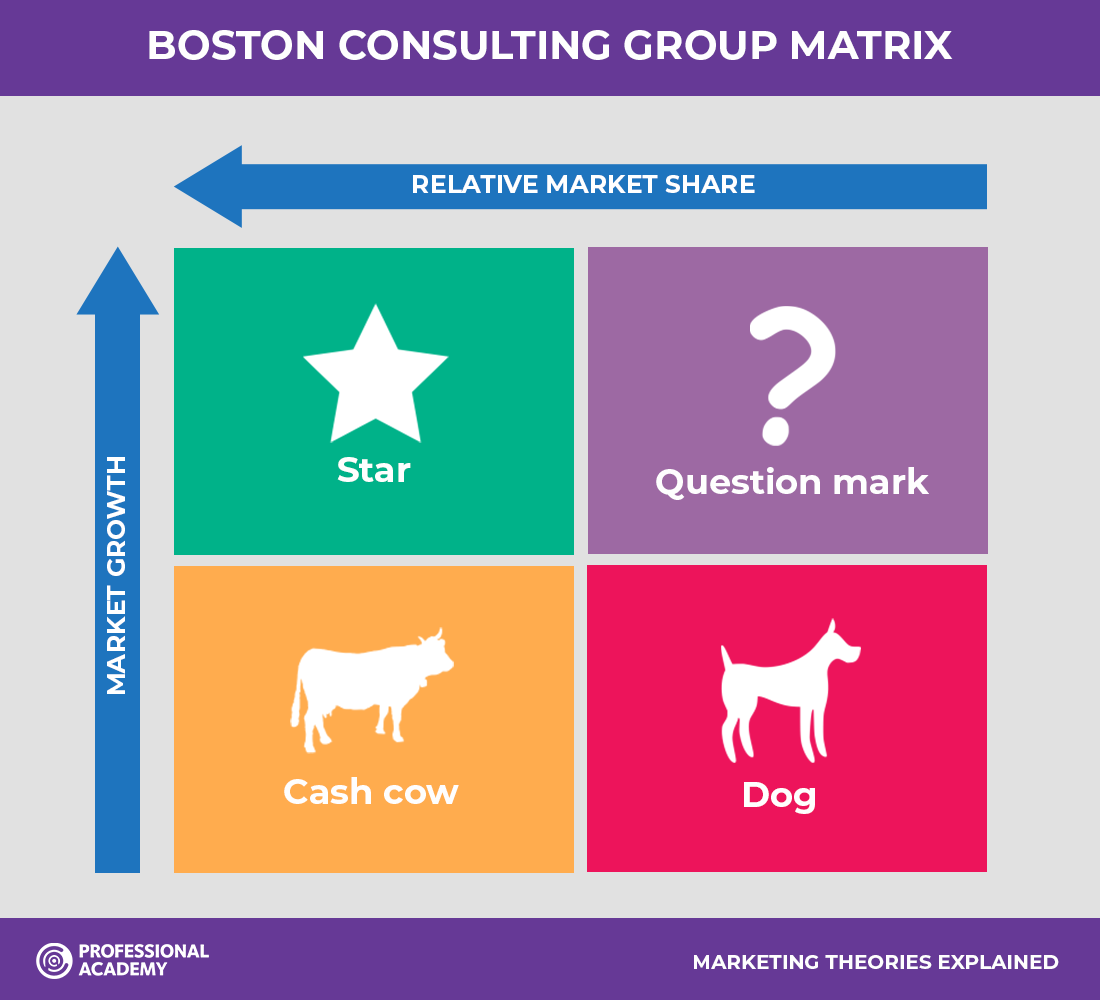
Star products all have rapid growth and dominant market share. This means that star products can be seen as market leading products. These products will need a lot of investment to retain their position, to support further growth as well as to maintain its lead over competing products. This being said, star products will also be generating a lot of income due to the strength they have in the market. The main problem for product portfolio managers it to judge whether the market is going to continue to grow or whether it will go down. Star products can become Cash Cows as the market growth starts to decline if they keep their high market share.
Cash cows don’t need the same level of support as before. This is due to less competitive pressures with a low growth market and they usually enjoy a dominant position that has been generated from economies of scale. Cash cows are still generating a significant level of income but is not costing the organisation much to maintain. These products can be “milked” to fund Star products.
Products classified as dogs always have a weak market share in a low growth market. These products are very likely making a loss or a very low profit at best. These products can be a big drain on management time and resources. The question for managers is whether the investment currently being spent on keeping these products alive could be spent on making something that would be more profitable. The answer to this question is usually yes.
Also sometime referred to as Question Marks, these products prove to be tricky ones for product managers. These products are in a high growth market but do not seem to have a high share of the market. The reason for this could be that it's a very new product to the market. If this is not the case, then some questions need to be asked. What is the organisation doing wrong? What are its competitors doing right? It could be that these products just need more investment behind them to become Stars.
A completed matrix can be used to assess the strength of your organisation and its product portfolio. Organisations would ideally like to have a good mix of cash cows and stars. There are four assumptions that underpin the Boston Consulting Group Matrix:
We hope that you have found this information useful.
If you're more of a visual learner, you can check out our animated YouTube video about the BCG Matrix and how you can use it to improve and develop your product range.
This theory forms part of the syllabus for some of the CIM courses that we offer. Please have a look at these if you would like to further your marketing knowledge and skills. If you would like more information on our CIM Marketing courses please download a copy of our prospectus today.
If you would like help referencing this blog, check out our Harvard Referencing Blog.