You’re offline. This is a read only version of the page.

Visit our Marketing Theories Page to see more of our marketing buzzword busting blogs.
You will have most likely heard of the Boston Consulting Group matrix (or BCG matrix), if not you can read about it in our BCG Blog! However the GE matrix is considered by many to be an extension, and even an improvement of that model. Like the BCG, the GE matrix helps you to determine how to allocate resources but it allows more flexibility.
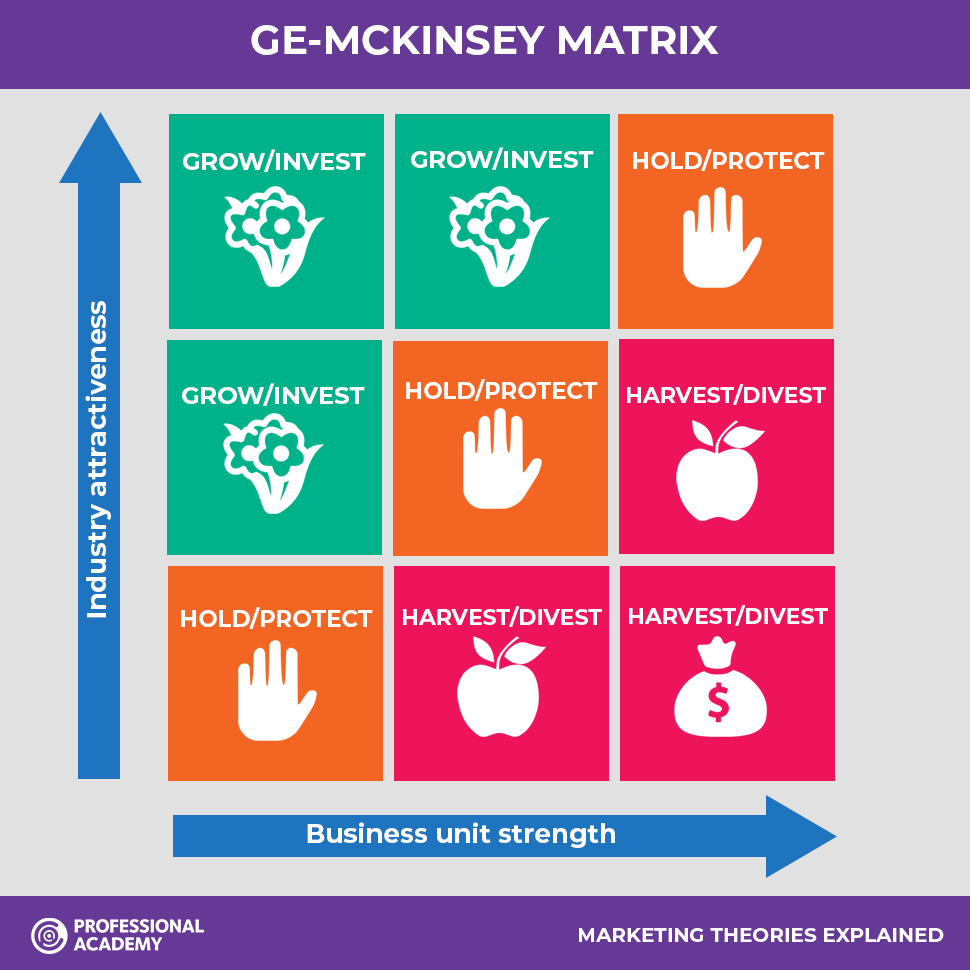
The GE matrix was developed by Mckinsey and Company consultancy group in the 1970s. The nine cell grid measures business unit strength against industry attractiveness and this is the key difference. Whereas BCG is limited to products, business units can be products, whole product lines, a service or even a brand. You can plot these chosen units on the grid and this will help you to determine which strategy to apply.
Before you can plot anything on the grid however first you need to decide how you will determine both industry attractiveness and business unit strength.
Factors you could choose to base this on include:
You need to decide which factors you will use as a determining factor as these will be applied to ALL business units.
Step 1: Decide on determining factors
Step 2: Give each factor a weighting number based on its magnitude (make the total weight of all factors add up to 1.00 or 10.00 for example)
Step 3: Rate each business unit against each factor on a scale. For example 1 – 5 where 1 is extremely attractive and 5 is extremely unattractive.
Step 4: Give each business unit a weighted rating on each factor by multiplying its rating by the weight for that factor.
Step 5: Total up all the weighted ratings for each business unit.
.png)
Factors to determine how strong a unit is compared to others in its industry include:
Repeat steps 1 to 5 here.
Now you have the measurements you can plot your business units on the GE matrix and depending on where they are plotted will determine your strategy from one of the following:
Grow/Invest:
Units that land in this section of the grid generally have high market share and promise high returns in the future so should be invested in.
Hold/Selectivity:
Units that land in this section of the grid can be ambiguous and should only be invested in if there is money left over after investing in the profitable units.
Harvest/Divest:
Poor performing units in an unattractive industry end up in this section of the grid. This should only be invested in if they can make more money than is put into them. Otherwise they should be liquidated.
As you can see this model is very useful for analysing your business units against multiple factors rather than the 2 dimensional approach of the BCG. In doing so you will have a starting point in which to build your strategy for allocating resources and expanding products.
If you would like to develop your marketing strategy knowledge further why not look in to studying a CIM Diploma in Professional Marketing with Professional Academy? Contact us today for more information.
If you would like help referencing this blog, check out our Harvard Referencing Blog.